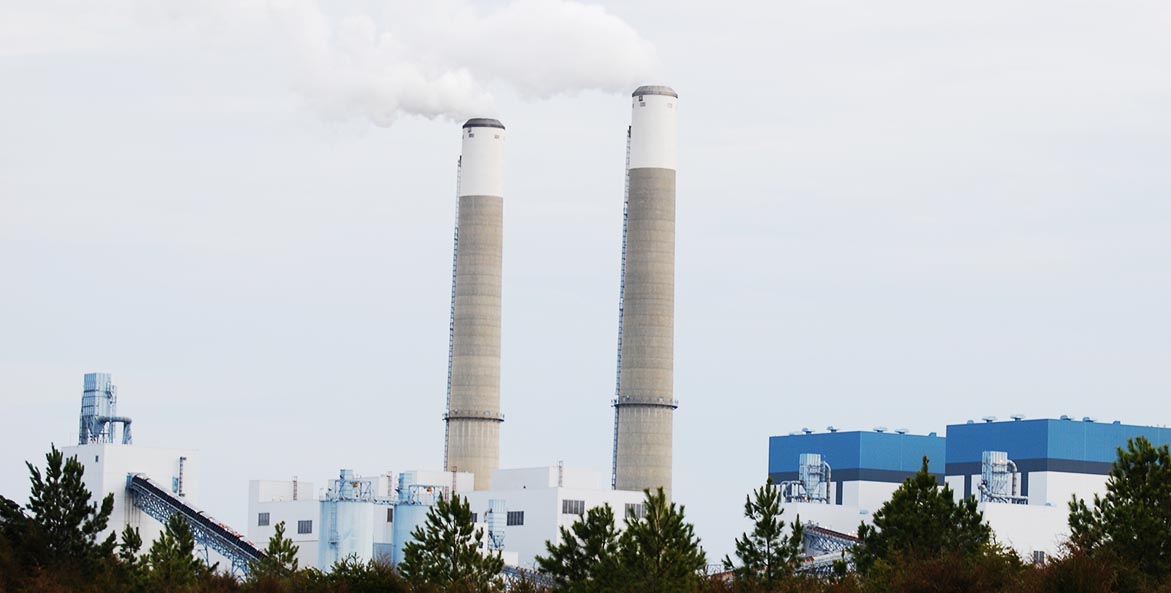
No doubt, climate change is an urgent, existential threat to the planet and our beloved Bay. But nearly a decade after EPA proposed the Clean Power Plan, dirty power plants still spew polluting, planet-warming greenhouse gases into the air virtually unchecked. What’s worse, most of these harmful emissions come from outside the Bay watershed.
We can’t fight climate change and its devastating impacts or boost our region’s climate resiliency if the Environmental Protection Agency (EPA) doesn’t limit carbon pollution from fossil fuel-fired power plants. That’s why CBF keeps pushing the agency to hold these power plants accountable and slash their greenhouse gas emissions.
In May, the Biden administration became the third administration in nine years to propose climate regulations for dirty power plants. The draft standards are a good start, but they still need work. So CBF recently joined a coalition of 29 environmental and public health groups urging EPA to make them stronger and finalize them quickly.
The watershed is already hard hit by impacts like sea level rise, which is slowly swallowing Bay islands and flooding low-lying communities even on sunny days. Warming waters hold less oxygen to sustain the fish, oysters, crabs, and other species that make our seafood industry world famous. And hotter average temperatures are wreaking havoc with farming and the rural economies it powers.
Tough greenhouse gas controls also help improve water quality in the Bay and its waterways. Fossil fuel-fired power plants don’t just emit greenhouse gases. They also emit an enormous amount of nitrogen oxides (NOx), making power these plants produce a major source of nitrogen pollution in the watershed, too. Reducing greenhouse gas emissions also reduces NOx emissions because burning fossil fuels produces NOx.Roughly one third of the excess nitrogen in the Bay and its tributaries comes from the air.
Excess nitrogen fuels the growth of algal blooms that suffocate important Bay species like oysters and crabs. It also causes respiratory problems and worsens breathing conditions like chronic lung disease and asthma. Reducing nitrogen levels is integral to meeting the cleanup goals EPA and the Bay states committed to in the Chesapeake Clean Water Blueprint and protecting the health of watershed residents.
When we talk about our region, we are referring to the parts of six states (Delaware, Maryland, New York, Pennsylvania, West Virginia, and Virginia), plus the District of Columbia, that make up the Bay’s 64,000 square-mile watershed. But coal- and gas-fired power plant emissions that affect the watershed and the more than 18 million people who live here don’t just come from inside the six-state watershed, like water pollution. Most greenhouse gas emissions that drive climate change and nitrogen pollution that hurts water quality and people’s health in the watershed comes from a much larger area known as the Bay’s airshed.
The Bay’s 570,000 square-foot Bay airshed is more than nine times larger than the Bay watershed. Its 16 states include parts of Indiana, South Carolina, Vermont, and Michigan, as well as parts of the Canadian province of Ontario.
Within this vast airshed lie 612 fossil fuel power plants that together generate a total of 414.7 million tons of carbon dioxide (CO2) a year, according to the most recent EPA data. Drivers would have to burn through 42.3 billion gallons of gasoline annually and cover 964.5 miles in gas-powered vehicles in a year to emit 414.7 million tons of carbon dioxide, according to the EPA Greenhouse Gas Equivalencies Calculator.
But three quarters of the 612 power plants emitting carbon pollution in the airshed, or 463, are located outside the watershed. Together those 463 electric utilities outside the watershed pump out 350.4 million metric tons of CO2 emissions annually. That’s 84.5 percent of all CO2 emissions generated in the Bay airshed are coming from states outside of the watershed.
That’s why strong federal emissions standards are so important—and why CBF remains committed to fighting for them.
To explore more about this issue, check out our interactive map showing the location of all 612 fossil fuel-fired power plants in the Bay’s airshed and their annual carbon dioxide emissions. You can also filter the view and related statistics relative to the Chesapeake Bay watershed (internal or external) or by state and/or county. Click on the emissions equivalencies tab at the bottom of the page to get an idea of how many gallons of gasoline, miles driven, barrels of oil consumed, and propane cylinders for gas grills it would take to produce the level of CO2 emissions generated by the plants you are viewing.


