On October 26th, Maryland's Department of Natural Resources released its 2017 Summer Hypoxia report, which stated results were the second best since water quality monitoring began in 1985. But wait–the Virginia Institute of Marine Science released their Hypoxia Report Card earlier this fall that said the results were 10% worse than 206 and similar to the results in 2014. Will the real hypoxia (aka "dead zone") results please stand up?
But first…What is hypoxia?
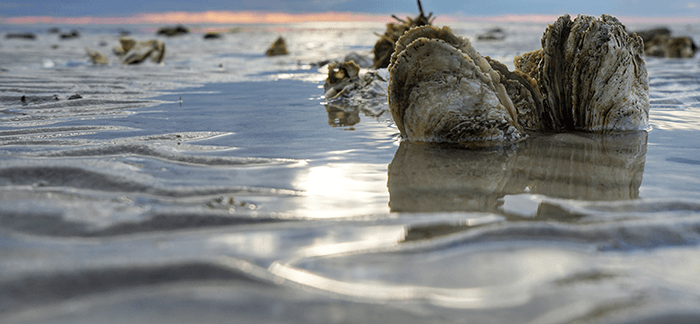
Hypoxia separates the healthy from the unhealthy waters, when it comes to available oxygen for animals and plants. Technically, hypoxia is when there is less than 2 parts per million (ppm) of dissolved oxygen in the water–which means the water is not completely devoid of oxygen (anoxic), but does not have enough to support aquatic life. The animals who can flee to healthier waters with more oxygen are the lucky ones. The critters who cannot leave (oysters!) often die, which is why we call these waters "dead zones."
How does hypoxia happen?
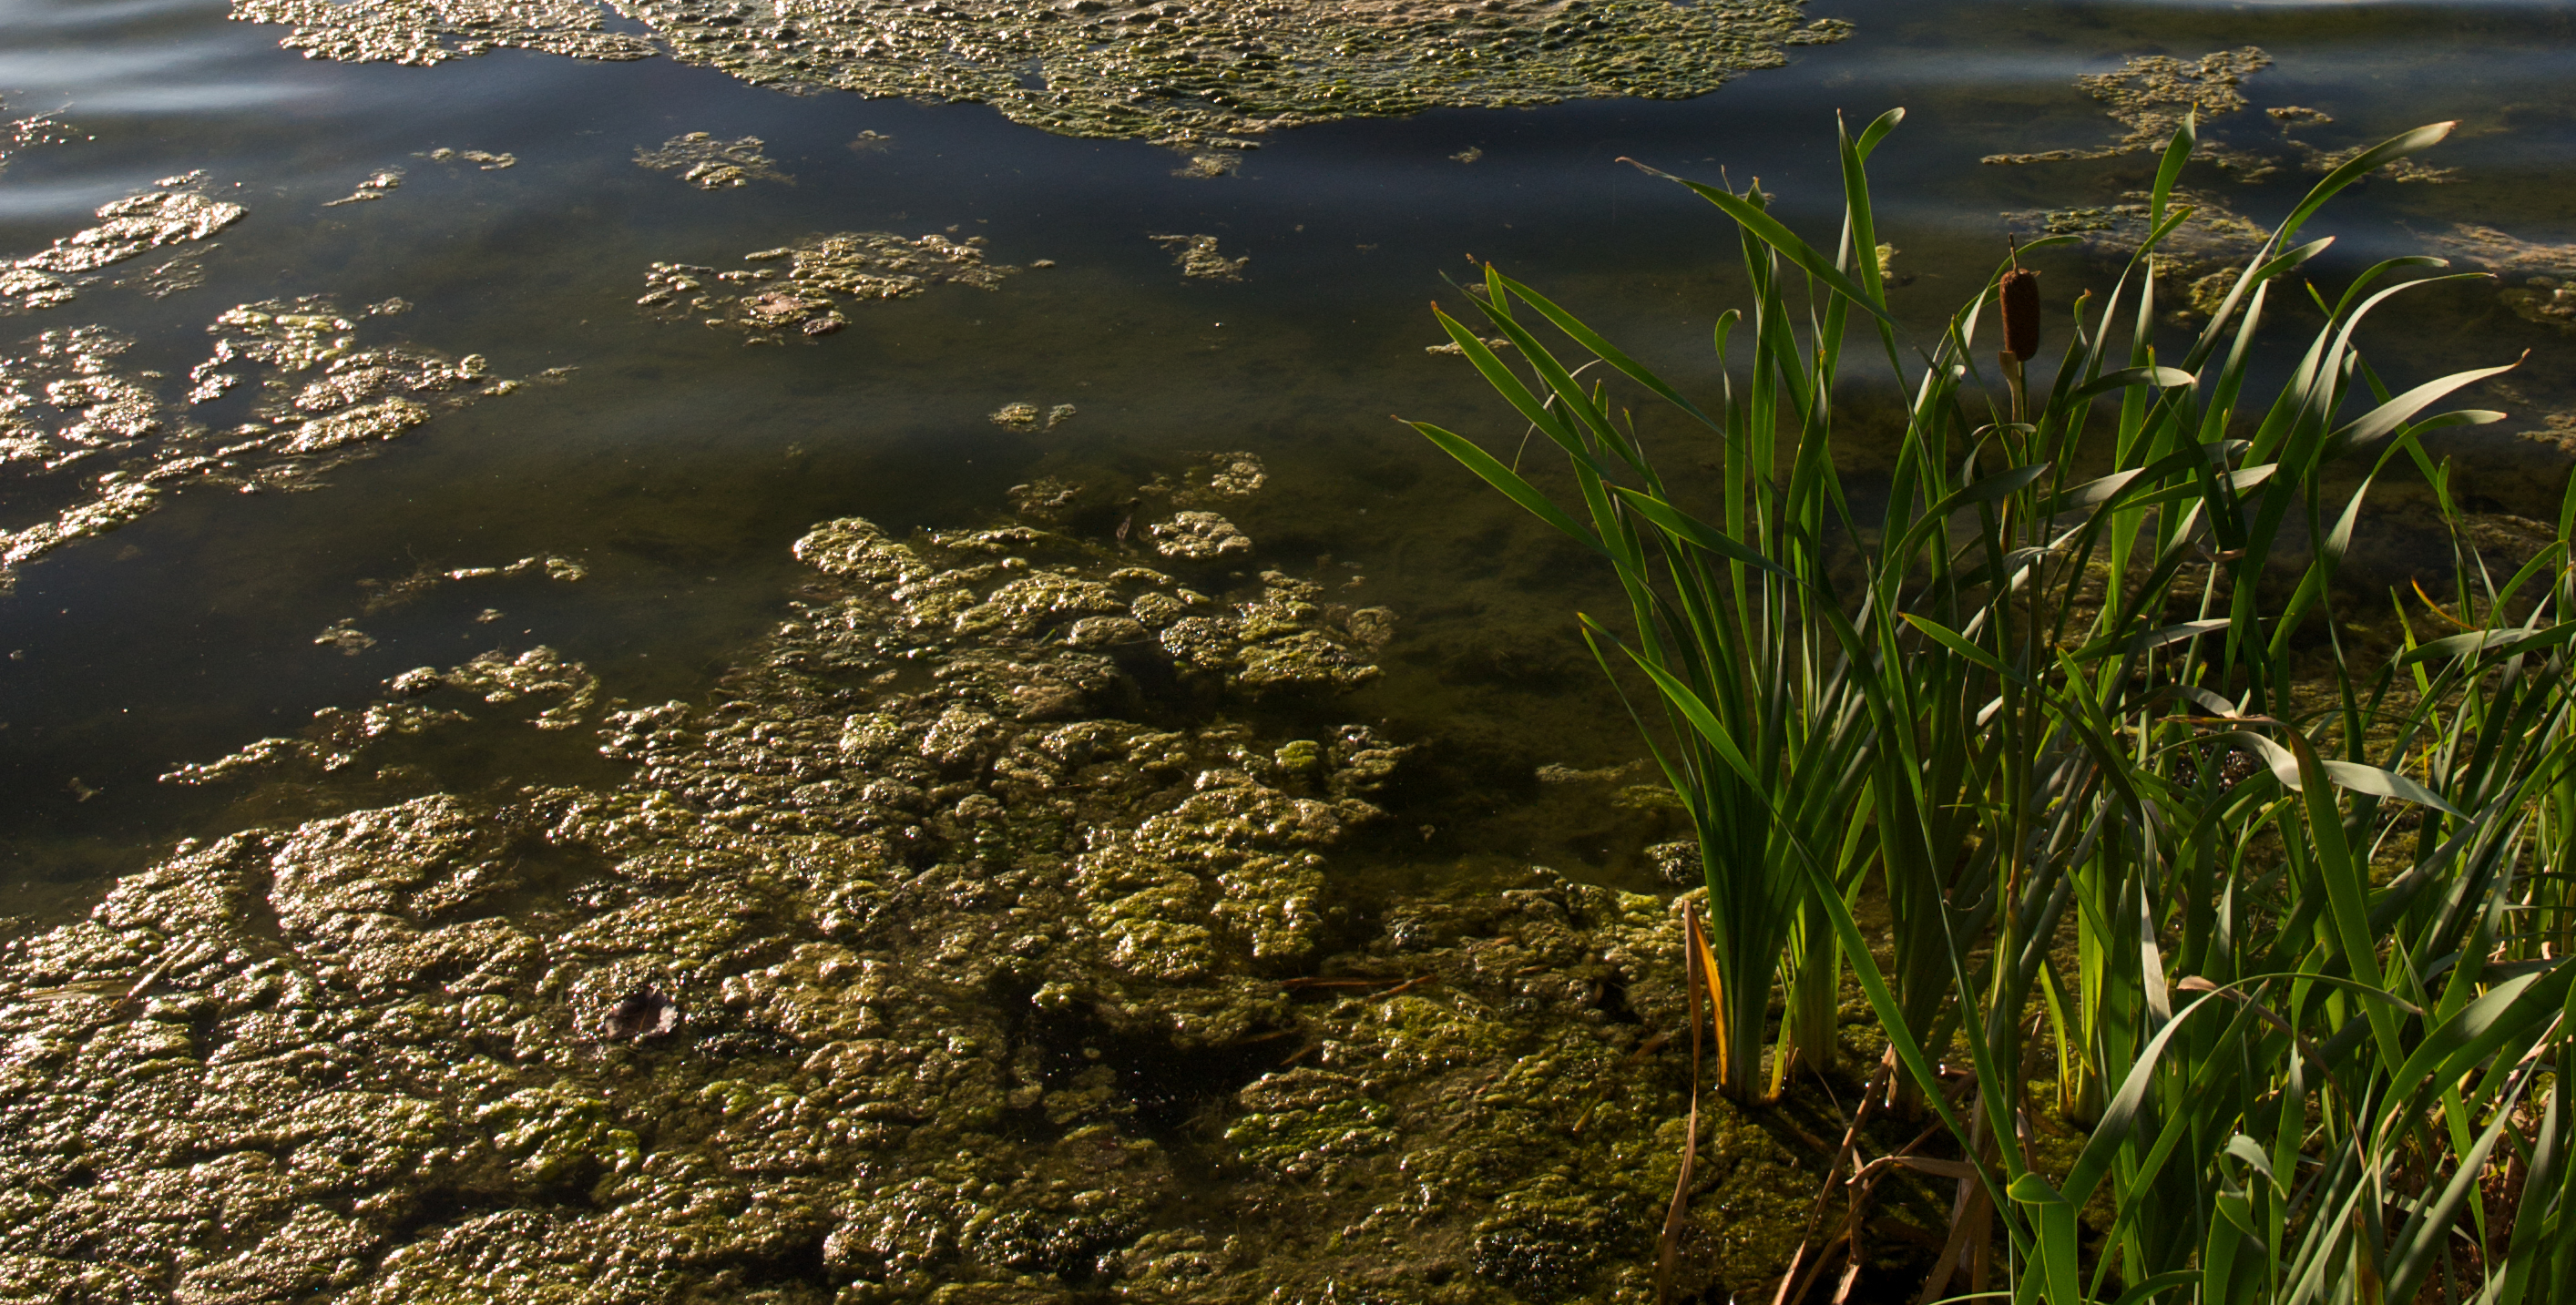
Hypoxia is caused by both natural forces and man-made pollution. Examples of natural causes of hypoxia include temperature and salinity levels that prevent oxygen from mixing into deeper waters (for example, warmer waters naturally have less oxygen), which explains why scientists believe that the Bay always experienced some hypoxia during the summer. In terms of pollution, hypoxia gets worse when too many nutrients enter waterways. Those nutrients fuel algal blooms and consume oxygen during decomposition. The current extent and duration of hypoxia is also far greater than before we lost precious filters, like trees, needed to keep nutrients out of the Bay.
What does the data tell us?
Maryland and Virginia both issued reports for 2017 conditions–Maryland's Department of Natural Resources (MD DNR) found that dissolved oxygen conditions were the second best since water quality monitoring began in 1985. The Virginia Institute of Marine Science (VIMS) reported different findings–they estimate that conditions were 10% worse than 2014 in both the Maryland Virginia portions of the Bay.
Huh? How can it be better and worse at the same time?

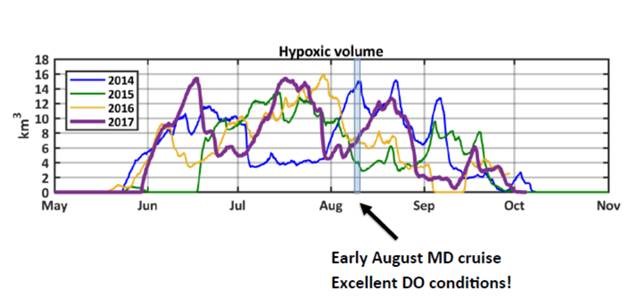
Hypoxic volume in in the Chesapeake Bay in the 2017.
Maryland’s Department of Natural Resources
It turns out that both states are correct. See the graph above. VIMS is estimating hypoxia (using a model and real data for temperature and wind) for the entire summer, whereas MD DNR is only measuring a snapshot in time. The purple line is the data for 2017, and you can see, for example, that the MD cruise in early August coincided with a time when hypoxia was relatively low. Another encouraging sign is that for the last three years the MD DNR monitoring cruises have not detected any anoxic waters–which is a first since water quality monitoring began in 1985! To be clear, that doesn't mean there isn't any anoxia in the Bay (just none detected during their cruises), but these results are another hopeful sign of Bay recovery.
What does this mean?
The overall message is best stated by Beth McGee: "There is scientific consensus that the dead zone is getting smaller over time, and ending earlier in the summer. This is an indication that the Clean Water Blueprint is working. But we also know that much more needs to be done to achieve a Bay that is healthy for all living creatures."
We will always have year to year variations in the dead zone due to the weather, but the long-term trend is very encouraging. The Chesapeake Clean Water Blueprint's ongoing programs to reduce nutrient pollution are working and we hope to keep on truckin' for smaller dead zones in years ahead.
Alice Christman
Issues in this Post
Dead Zones Algal Blooms Dead Zones CBF in Maryland CBF in Virginia


